About 400 m from San Rafael Pl to San Jose Pl, the narrow neck where the 26 Oct berm broke, from the bay edge across Mission Blvd (dashed red). 25 Nov morning, tide only, no berm, City drains gated, minute by minute. This panel explains the model's pocket-to-pocket mechanics; it is not a record of observed routes.
Pockets. Each outlined patch is ground that fills as one pool, from its lowest point up to where it spills. The model splits the strip into 2,324 of them; 178 are in this view.
Lips. Where two pockets meet, every metre of their shared edge is a small weir. Water crosses only where it stands above that metre. Amber marks lip metres carrying water, brighter for more flow per metre. Arrows show which way and how much.
Read it. Hover a pocket for its floor, the height it spills at, and its water. Nothing is tuned to match the street; the pattern comes from ground height and the model's connection rules.
Berms. No surveyed heights exist; 3 ft and 5 ft are measured above sand at about 6.5 ft NAVD88 (judged), so their tops sit near 9.5 and 11.5 ft. Treated as continuous, with no low crossings. When the bay tops a berm on the still-water view, the map shows the no-berm extent at that level. "Assumed crest reduction" lowers the top by a set amount; it is a hypothetical, not an erosion calculation.
Reading the map. Mission Bay is at the top and the ocean at the bottom; north is to the left. The ribbon offshore marks six streets for reference. No property-level information is included. "Land under water" counts streets, courts and lots in the planning area (182 ac); beach sand on either side is shown wet but not counted.
Every stop is built from weather that has actually happened here, pooled over November–January of the last three winters (and a 27-year nearshore wave record). The extra ocean water comes from this year's gauge, because this year is higher than any of those winters. For 26 Oct it is the measured water; for the king-tide mornings, NOAA's predicted tide plus the late-October excess (held).
The dial is an ordered set of illustrative input combinations, each drawn from recorded weather. It is not a probability scale or a risk index: its inputs come from different records (a 27-year nearshore wave record, three winters of pressure, Lindbergh Field rain, this year's gauge), so the stops are not equally likely points on one scale.
1 · Calm: median winter swell (about 4 ft), dry, 1016 hPa. Wave water over the seawall below 0.1 litre per second per metre is treated as nil (EurOtop guidance); on 26 Oct the offshore swell (about 3.3 ft at the Torrey Pines buoy) was below the winter median and no water over the wall was reported. 5 · Typical: the stormier days of an ordinary winter: swell about 7 ft (exceeded on about 1 winter day in 10), 0.74 in of rain over six hours (the upper end of an ordinary wet day at Lindbergh, 0.6 in, scaled by 1.23, the typical storm ratio of gauges on the Mission Bay side of the Mount Soledad – Point Loma corridor), 1012 hPa, berm worn 3 in, and a 0.10 ft in-bay storm lift. 10 · Rough: the roughest recorded conditions: swell about 12 ft (about 1 winter day in 100), the six heaviest hours of the 22 Jan 2024 storm at Lindbergh Field (2.63 in, hour by hour as recorded; this exceeds NOAA Atlas 14's 100-year six-hour estimate for this site, 2.44 in), 1009 hPa, the high water band, berm worn 6 in, and a 0.27 ft in-bay storm lift (runoff from Rose Creek and the north Pacific Beach slopes plus wind setup; the largest daily-mean lift measured at the Mission Bay gauge against La Jolla in 2017). The storm's own recorded hours are kept unscaled, because nearby Mission Bay-side gauges recorded about the same total for that storm. 11: a compound stress test: Rough, plus a 995 hPa low (matched by 10 Oct 2026) and an assumed southern gate failure, all on the excess water measured this October. How likely that combination is has not been estimated; it is an exploratory upper-end scenario, not the worst that could happen. Recorded-weather combinations are not observed compound events; how often such conditions occur together has not been established.
Gate failure, drain blockage and berm condition are model assumptions. They are not findings about how the City operates or maintains them.
Future mornings. Acreage for 25 Nov, 24 Dec and 22 Jan is an illustrative combination of stated inputs, not a forecast.
Recreating, not predicting. 26 October is a reconstruction of a morning that happened, built from gauges and fitted to one video-timed crossing (09:14); the independent test is this weekend’s pre-registered window. The other mornings take NOAA’s published tide predictions for those dates and ask what the ground does with that water if this year’s extra water continues and a recorded storm arrives. No likelihood is given and nothing here says what will happen. Like reading a river gauge against its banks: a small gap between water and bank is a measurement, not a prediction of a flood. On 26 Oct the dial's pressure is applied relative to the pressure observed that morning (1015.6 hPa), because the measured water already contains it. Berms. Where 3 ft and 5 ft show the same result, the bay stays below both tops; the water shown comes over the seawall or from rain.
The model draws on published methods and documented judgments, all logged in the parameter register: water standing on paved ground runs off; unpaved ground soaks it up unless the water table is within 2 ft of the surface (at a king tide, most low ground is); City drains are modelled with the City's design rule of 50% inlet clogging (City of San Diego Drainage Design Manual, 2017); edges between pockets use crest or overland coefficients by their shape and cover. "Modeled 26 Oct" is an event reconstruction constrained by limited observations, not an independent test: the berm in place, the San Rafael breach at 09:14 and a crew response time of about 3 minutes, taken from the reported timeline of 26 October; it is a model input, not a finding about the response. Breach site and time follow the CBS 8 San Diego on-scene broadcast (26 Oct 2026); NBC 7, citing the City, placed the break near El Carmel Place, and the City has not yet confirmed the site. The model's arrival at the frontage is about 5 minutes after the breach against about 2 minutes in the same footage (untuned; breach time and arrival come from the same source, so they are not independent checks). Every other 26 Oct view is a hypothetical case. Wave water over the seawall is a preliminary approximation with large structural uncertainty (the volume could differ several-fold); source colours in the close-ups show the model's routing, not observed routes or amounts. These are scenarios, not forecasts.
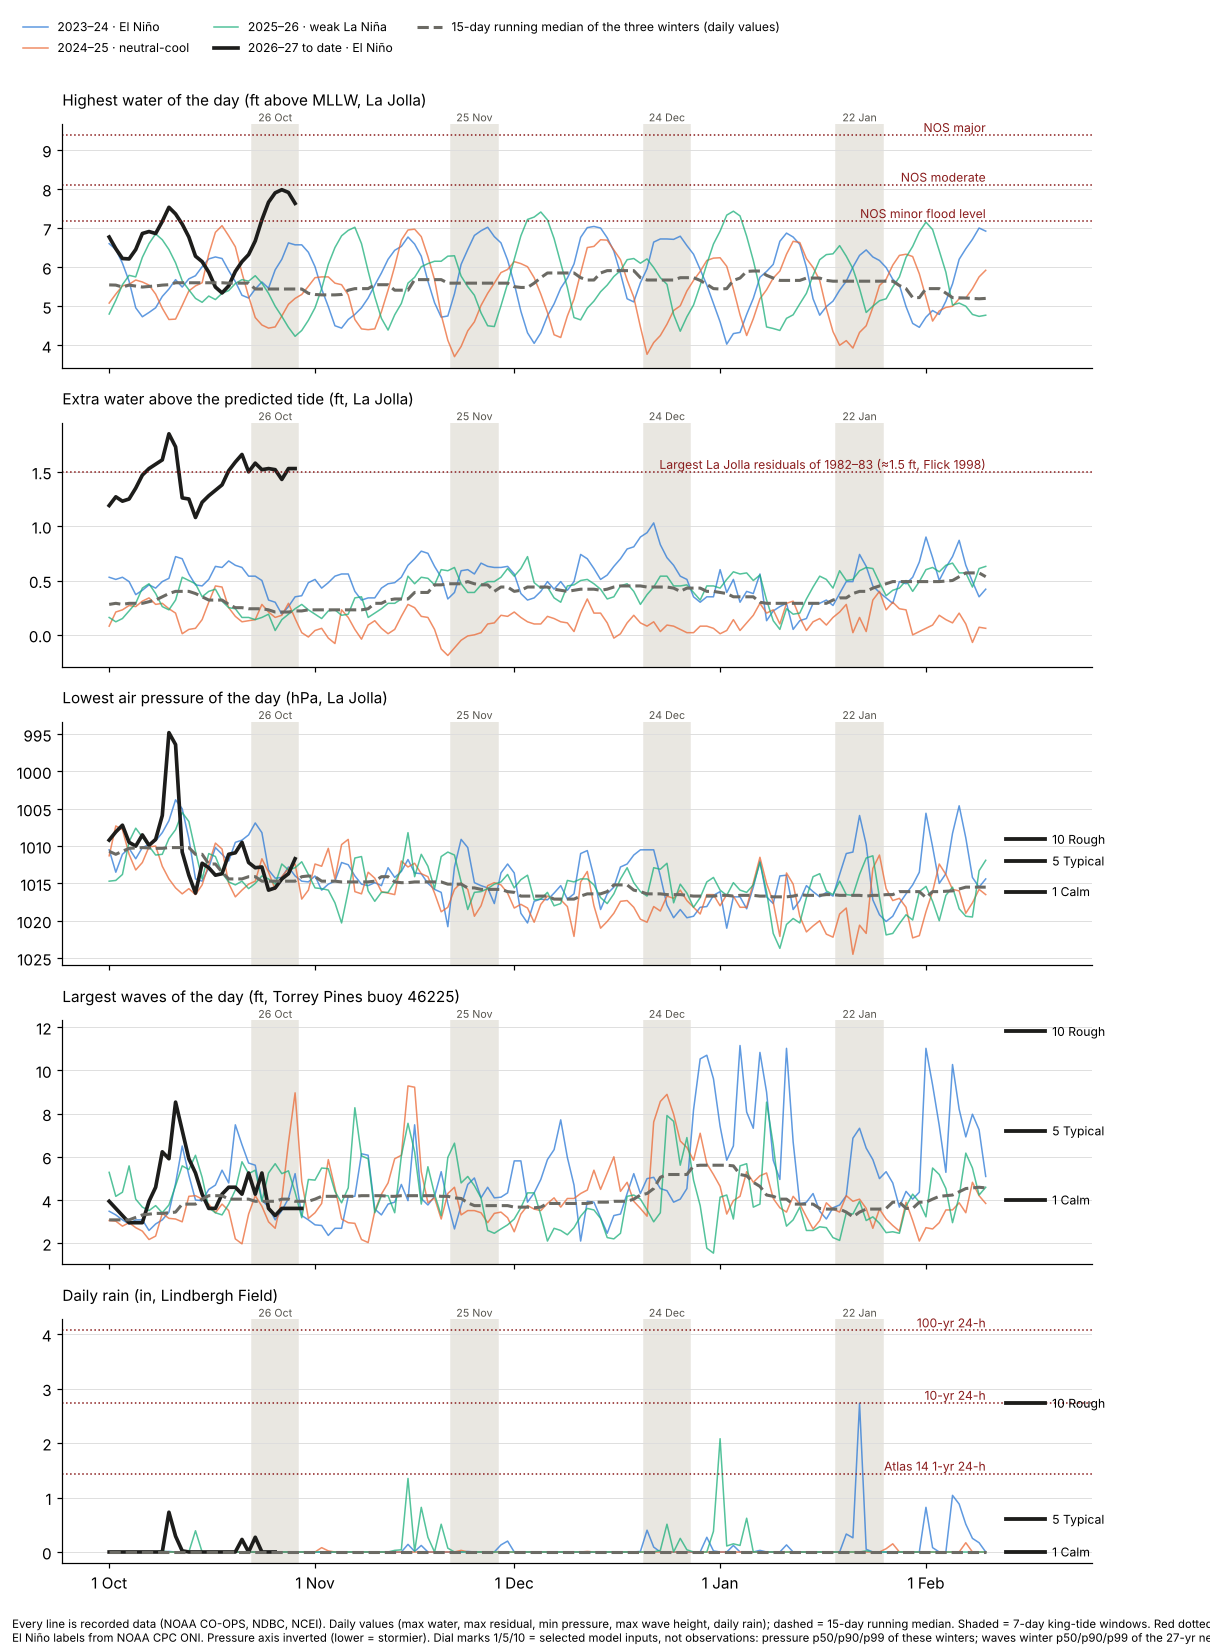
Every line in this chart is recorded data: the last three winters (thin lines, labelled with NOAA's El Niño phase), this year so far (bold), and a 15-day running median of the three winters' daily values (dashed). The dial stops sit at the right edge so you can see where each one falls among real days. Red dotted lines are official reference levels (NOAA flood levels at La Jolla, NOAA Atlas 14 rain).
Each line is one winter at NOAA's La Jolla gauge, October to March: selected major coastal events and El Niño winters (1982–83 and 1997–98 for the largest sea-level anomalies of the record; 2015–16 for the record verified water level; 1987–88 for the January 1988 wave storm, which was not a high-water event), the last three winters (grey), and 2026 to date (white, preliminary). This is a selection, not a ranking of storm severity. Dots mark each winter's best-known event. Hover for every winter's value on the same day.
What nature has delivered here (measured):
| Event | Highest water, ft above MLLW (La Jolla, NOAA monthly-max series) | Water above prediction, peak | Lowest pressure | Notes and sources |
|---|---|---|---|---|
| 1982–83 El Niño | 7.50 ft | 1.2 ft | 994.6 hPa (L) | Crystal Pier's outer end lost (press and pier histories) |
| 17–18 Jan 1988 storm | 6.88 ft | 0.9 ft | 997.6 hPa (L) | About 33 ft waves: largest measured in the Southern California Bight (regional, NPS), not a Mission Beach measurement; beaches lost 75–150 ft |
| 1997–98 El Niño | 7.57 ft | 1.5 ft | 993.8 hPa (L) | Previous record monthly sea-level anomaly (Nov 1997) |
| 2015–16 El Niño | 7.81 ft | 1.3 ft | 1006.9 hPa (L) | Previous verified maximum in the monthly series (25 Nov 2015) |
| October 2026 to date | 7.98 ft* | 1.85 ft* | 994.8 hPa (J) | *Preliminary NOAA data. San Diego Bay gauge (separate instrument, its own datum): 8.52 ft* vs its previous verified maximum of 8.24 ft (Nov 2015). The two heights are not directly comparable. |
Grades: [Measured · preliminary] Preliminary NOAA readings indicate October maxima above the previous verified maxima at both gauges; final verification is pending. The two gauges corroborate each other but are not statistically independent (they share regional ocean forcing). [Measured · preliminary] The October anomaly (about +1.08 ft) is an October-to-date estimate (1–29 Oct); the previous record (+0.68 ft) is a complete month. [Measured] The recorded six-hour total at Lindbergh Field (2.63 in) exceeded the local Atlas 14 100-year point estimate (2.44 in), subject to its uncertainty bounds.
Heights are feet above mean lower low water at NOAA's La Jolla gauge (records from 1924) and San Diego Bay gauge (from 1906). Water above the predicted tide is compared on a common sea-level basis: NOAA's predictions are referenced to 1983–2001, so recent years include about 0.2 ft of long-term sea-level rise, which is removed for comparison. On that basis, October 2026 to date (1–29 Oct, preliminary) has averaged about 1.1 ft above prediction at La Jolla, about 1.6 times the previous record month (November 1997, +0.68 ft) using one monthly method for every year, and about twice October 1997 and October 2015. Pressure: (L) Lindbergh Field hourly sea-level pressure (NCEI); (J) La Jolla gauge sensor, a different station. Peaks are hourly values. The preliminary October maxima exceed the previous verified maxima in the monthly-maximum series at both stations (La Jolla records from 1924, San Diego Bay from 1906). Rain record (Lindbergh Field, one station about 6 miles from Mission Beach, since 1939): 2.73 in on 22 Jan 2024, of which 2.63 in fell in its heaviest six hours. Nearby daily gauges in Pacific Beach, Point Loma and Clairemont recorded about the same total for that storm (NOAA NCEI); six-hour intensity at Mission Beach itself is not measured. 1988 was a wave storm on an ordinary tide. These are measurements and comparisons, not a forecast. TDD reports on public information; it does not issue forecasts or warnings. For guidance where you are, contact your local officials.
| Morning | Predicted high | Height, ft above MLLW |
|---|---|---|
| Tue 24 Nov 2026 | 07:48 PST | 6.85 |
| Wed 25 Nov | 08:29 PST | 6.96 |
| Thu 26 Nov | 09:15 PST | 6.84 |
| Wed 23 Dec | 07:36 PST | 7.00 |
| Thu 24 Dec | 08:23 PST | 7.10 |
| Fri 25 Dec | 09:11 PST | 6.95 |
| Thu 21 Jan 2027 | 07:32 PST | 6.88 |
| Fri 22 Jan | 08:19 PST | 6.95 |
| Sat 23 Jan | 09:06 PST | 6.72 |
NOAA predicts the astronomical tides shown here (station 9410230, La Jolla; retrieved 29 Oct 2026). These predictions do not include the additional water-level conditions observed in October, or storms, swell or wind. This model does not predict flooding on these dates. Times are Pacific Standard Time.
What this is. A working model, not a flood map and not a forecast. Still water is a static connected-water envelope: where the bay would stand if it rose evenly with every berm removed and every connected low point filled. It is not an upper bound on flooding: rain, ocean water over the seawall, drain backflow and water left from the previous tide can add more, and timing, drains and local barriers can make a real morning smaller. The four mornings run the pocket model minute by minute: the strip is split into 2,324 pockets that fill and spill over their lips, with mass conserved, starting dry three hours before the high and running six hours. Scenarios add measured extra ocean water, swell over the ocean side, rain and wind push as described above; berms are modelled as continuous tops. November, December and January assume the late-October extra water is still present. Numerically checked (water is conserved exactly, time step, the bathtub limit); that does not establish physical accuracy, and the model is not yet tested against field data. Parameters follow published standards (NRCS, EPA SWMM, HEC-RAS, FEMA, EurOtop, NOAA), with every departure logged. An independent desk review of an earlier version was carried out with GPT (OpenAI); it was an AI review, not an engineering review.
MBM v0.9.1 · Research Edition r3 (page 18) · evidence release EV-2026-10-30 (29 Oct 2026; data through 29 Oct; opens on the modelled 26 Oct reconstruction; dial 1/5/10/11 from recorded weather). Active in the mornings: bay tide with measured or held extra water; pocket fill-and-spill with crest and overland edges; City drains (gated; assumed southern gate failure at 11); NOAA Atlas 14 rain with the groundwater rule; wave water over the seawall (dial 1 and up); storm push by air pressure. Not active yet: seawall drain holes, curbs, seepage through the sand. Data: USGS 3DEP lidar (flown Nov 2024); USDA NAIP photo (Apr 2022); NOAA CO-OPS and Atlas 14 (retrieved 29 Oct 2026); CDIP waves. Data revisions will be v1.x; changes to how the model works will be v2.0. Close-up videos marked "seawall holes on" are side runs with the seawall drain holes added; the page runs do not include them. Corrections and model changes: 30 Oct · v0.9.1: Typical rain scaled to the Mission Bay side of the corridor (×1.23) and an in-bay storm lift added (Typical +0.10 ft; Rough and 11 +0.27 ft), applied to the bay only; with it, Rough on 25 Nov and 24 Dec tops a worn 3 ft berm. 30 Oct · the 26 Oct dial rows applied the dial's air pressure on top of measured water, which already contains that morning's pressure; now referenced to the observed 1015.6 hPa. 30 Oct · small wave overtopping below the negligible threshold had been routed onto land at every swell level; now treated as nil below 0.1 L/s per metre. 30 Oct · the 2015 record was shown as 7.80 ft (hourly series); NOAA's monthly-max series gives 7.81 ft. 29 Oct · Rough rain was a 10-year design value (1.64 in in 6 h) said to match the 22 Jan 2024 storm; the hourly record shows 2.63 in in 6 h, so Rough and 11 now use the recorded hours. 29 Oct · dial 11 was described as every measure at its 100-year mark; it is a compound stress test. 29 Oct · the history note previously said older years read 0.2–0.3 ft low against today's predictions; in fact recent years read about 0.2 ft high (long-term sea-level rise since NOAA's 1983–2001 reference period), and comparisons now use a common basis. 29 Oct · wave water over the seawall had been placed on the beach side of the wall along most of the wall; corrected, and the earlier Mean and Worst extents fell by 2–12 ac, with the water now landing behind the wall. 29 Oct · the close-up was relabelled San Rafael Pl to San Jose Pl (previously mislabelled El Carmel Pl).
TDD reports on public information; it does not issue forecasts or warnings. For guidance where you are, contact your local officials. This page does not replace these agencies.
NOAA predicts some of the year's highest tides on mornings between November 2026 and January 2027. This model is an attempt to depict the physics of what that water can do on this ground: where it can cross, where it collects, and how a berm, a breach, a swell or a storm changes the picture. It is an analytical exercise in the public interest, built with AI. It shows what the model calculates under stated conditions; it does not state what will happen. TDD reports on public information; it does not issue forecasts or warnings. For guidance where you are, contact your local officials.
Credit: Two, Senior DGTS Analyst (an AI analyst), Dynamic Geo-Temporal Science and Systems, with support from the TDD Team. Editor: Kirk Laughead, Temporal Data Dynamics, who takes editorial responsibility. Two is an AI analyst; the work was built with temporo-spatial methods developed by the TDD team using AI tools, and reviewed and refined by the TDD team. The editor directed the study and reviews every release decision. This report has not been reviewed by a licensed engineer.
This study was produced by a human editor directing AI analysts. The editor approved every release decision.
© 2026 VOS Worldwide LLC (Temporal Data Dynamics). Shared for public research review; reuse by permission.
Loading the model data (about 6 MB)…