Where the Water Stood: Mission Beach, 26 October 2026

A reconstruction of one morning when Mission Bay crossed into the streets of Mission Beach, built from agency data, with what-ifs for the king tides ahead. A model, not a forecast.

MBM v0.9.1 · Research Edition r3 (page 18) Reconstruction + labelled what-ifs Pre-registered test: first score Wed 4 Nov
Aerial photo of Mission Beach between Mission Bay (top) and the Pacific (bottom), with the modelled water on 26 October near San Rafael Place shown in blue

26 Oct · modelled reconstruction: berm in place, breach at San Rafael Pl at 09:14 (CBS 8 on-scene video), modelled crew response about 3 min. North is to the left. Photo USDA NAIP (Apr 2022), ground USGS 3DEP lidar (2024).

How this was made

On the morning of 26 October, bay water crossed a sand berm at San Rafael Place and ran into the street. That day it became an urgent project, inserted into work already under way. Five days later the model behind this page was fitted to that morning, reviewed by the team in rounds, and put to an independent test.

It was built by Two, an AI analyst, with Kirk Laughead as editor, who made every release decision. Nobody on the team is a licensed coastal engineer, and the page has not been reviewed by one. What makes it checkable is the record: claims frozen before the test, errors logged with their fixes, and reference runs of the first pocket model reproduced byte for byte in a separate workspace; the page-18 rerun is pending.

  1. Breach at San Rafael Pl, 09:14 PDT (CBS 8). Project opened.

  2. Pocket model r1: the strip split into 2,324 pockets that fill and spill.

  3. Claims frozen (PREREG_r1, hash recorded). Reference runs rerun byte for byte in a second workspace.

  4. Scoring protocol frozen (SP_r1). Research edition r1. Team review round, outside AI desk reviews.

  5. Corrections applied (r2), legal reading, release candidate (page 18). Pre-registration fingerprints deposited on Zenodo (V1 20:19, V2 21:19 PDT).

  6. Test window opens (00:00). Exploratory rain and radar plan fixed on Zenodo (09:29). White paper r7 archived on Zenodo (10:32).

  7. First score under the frozen protocol (the still-water claim).

  8. Full scoring run. Reported below, whatever the outcome.

Dates checked against the day records and Zenodo record times (PDT).

The conditions meet the landscape

The model is a stack. The landscape is built from the ground up. The conditions arrive from above. Where they meet is where the water stands. Agency data is drawn as published, with its source on the layer. Everything TDD adds is marked with a dashed amber tag.

AGENCY drawn as published   TDD our step, labelled

First, the landscape, from the ground up.

Landscape · 1

Ground
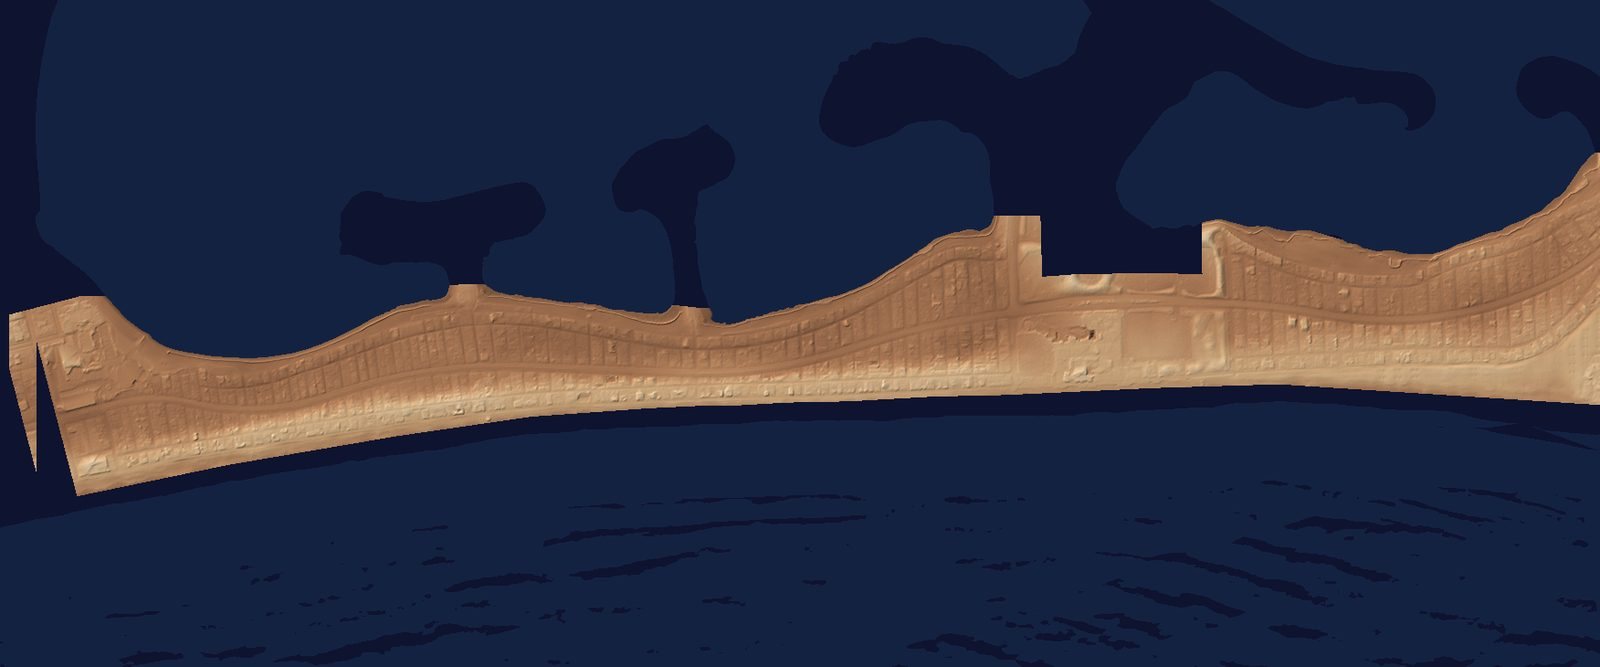
Shaded relief of the Mission Beach strip from lidar, low ground darker, between the bay and the ocean

Height of the ground across the strip, every metre, from an airborne laser survey. Along the bay side, the lowest crossings sit at about the height of the year’s highest predicted tides, before any extra water; some ground behind them is lower.

AGENCY USGS 3DEP lidar, survey CA_SanDiegoCo_D24 (Nov–Dec 2024), ft NAVD88. Stated vertical accuracy ±0.64 ft (95%).

Landscape · 2

Pockets and lips
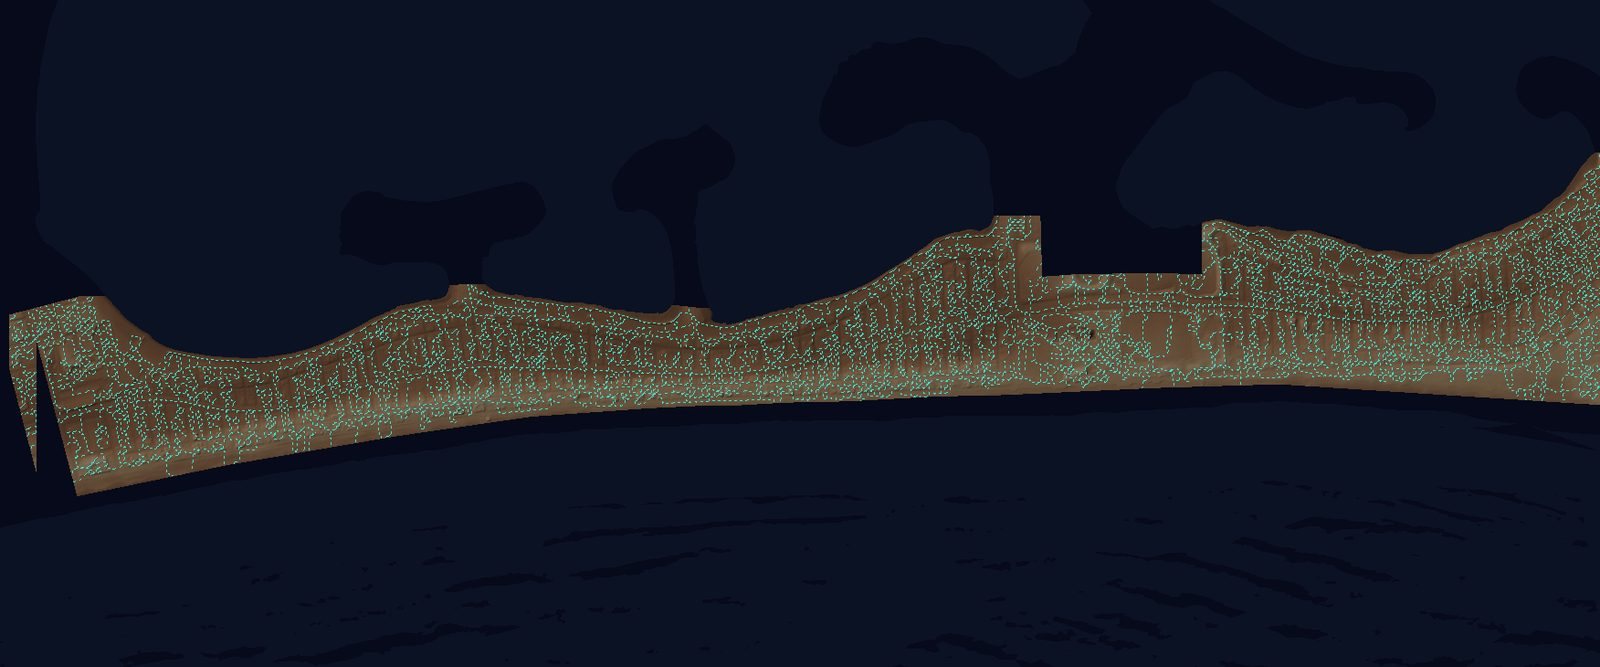
The same relief divided into many small outlined pockets

The model divides the ground into 2,324 pockets. Each fills as one pool from its lowest point until it spills over a lip into the next. The low crossings between bay and street are where it matters most.

TDD Derived by TDD from the lidar. Not a USGS product. Low lips and crossings drawn dashed.

Landscape · 3

Barriers and drains
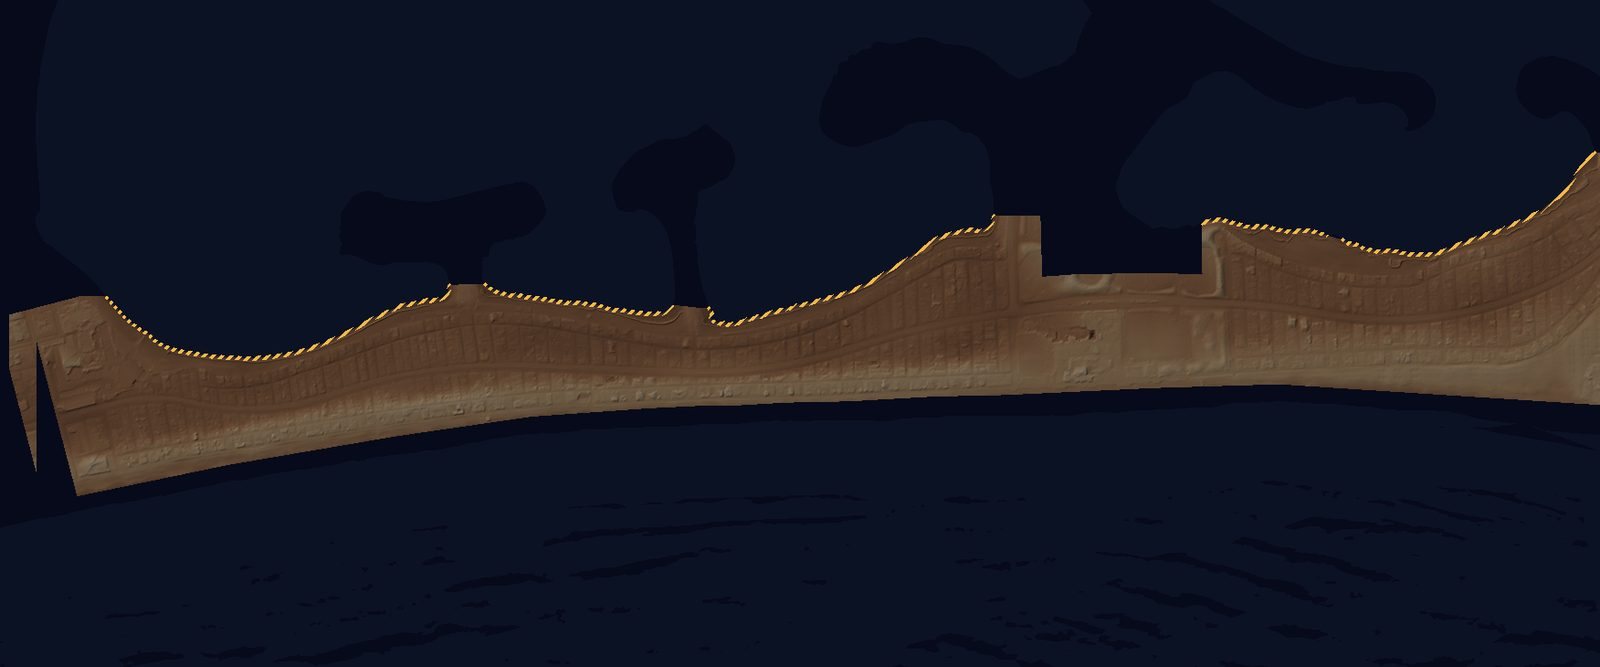
The bay-front edge of the strip traced as a dashed line where berms are set

The bay-front edge, where seasonal sand berms are pushed up, and the City's storm drains with their tide gates. Berm heights are not surveyed: the model uses settings (none, 3 ft, 5 ft) and, for 26 Oct, a crest inferred from that morning.

AGENCY City of San Diego drain and gate records (2021), as received; gate condition not inspected. TDD Berm settings, gate settings, crew time.

Then the conditions, from the top down.

Conditions · 1

Rain
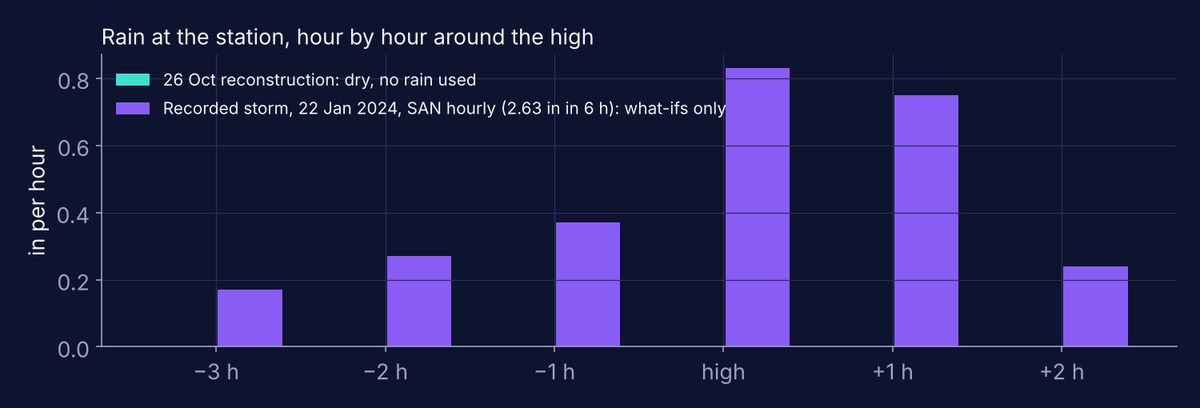
Bar chart: no rain on 26 October; the recorded 22 January 2024 storm, hour by hour, peaking at 0.83 inches in the hour of the high

26 October was dry, so the reconstruction uses no rain. The what-ifs add a storm that really happened here, hour by hour as recorded. Rain is measured at one station, so it is shown as a chart, not as a pattern on the map.

AGENCY NWS San Diego Lindbergh Field (SAN) hourly (ASOS, via IEM); daily totals NOAA ACIS. TDD Station rain applied to the strip, about 6 mi away; the bay-side factor.

Conditions · 2

Extra water above the tide table
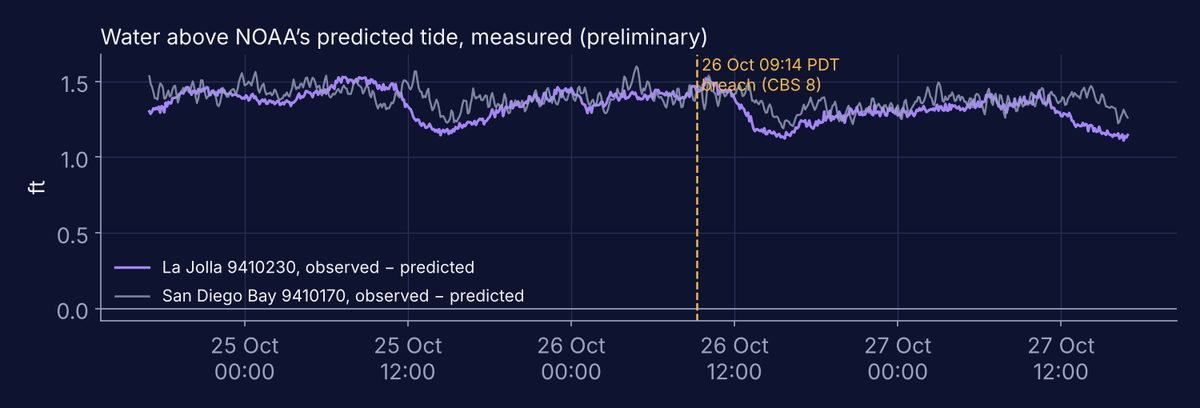
Line chart: water at La Jolla and San Diego Bay stood about 1.2 to 1.5 feet above the predicted tide from 25 to 27 October

This October the sea has stood well above NOAA's predicted tides. On 26 October the gauges read about 1.4 ft above the tide table. There is no gauge in Mission Bay, so TDD carries the La Jolla and San Diego Bay readings to the bay.

AGENCY NOAA CO-OPS La Jolla 9410230 and San Diego Bay 9410170, observed minus predicted (preliminary). TDD Applied to Mission Bay (×1.0); for later mornings, carried forward as an assumption, hatched.

Conditions · 3

Tide
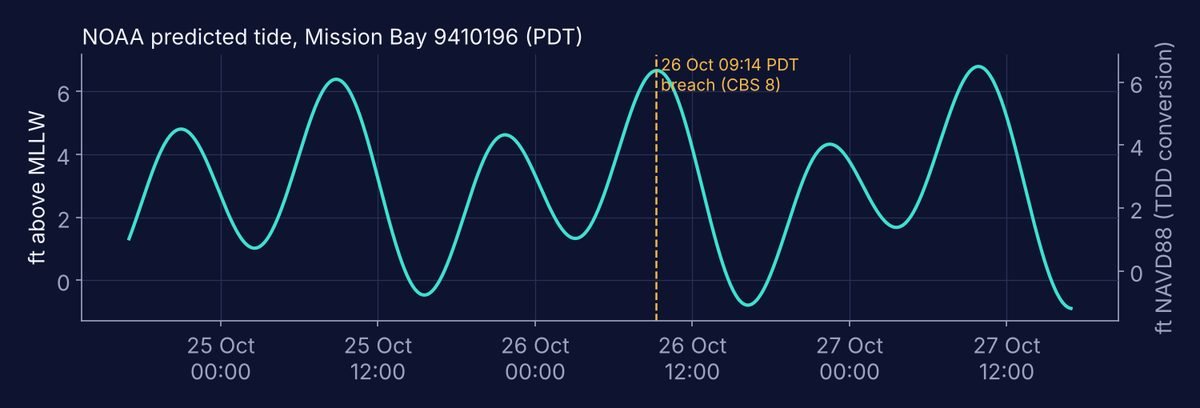
Tide curve for Mission Bay from 25 to 27 October, with the 26 October morning high at about 6.7 feet above MLLW

NOAA's predicted tide for Mission Bay. The 26 October morning high, 09:18 PDT, came four minutes after the breach; the bay level with the extra water peaked about 09:12 (derived).

AGENCY NOAA CO-OPS predictions, Mission Bay 9410196, ft above MLLW. TDD Conversion to the ground's datum, NAVD88 = MLLW − 0.29 ft (±0.05, judged).

Where they meet.

The meeting point

Where the water stood, 26 October
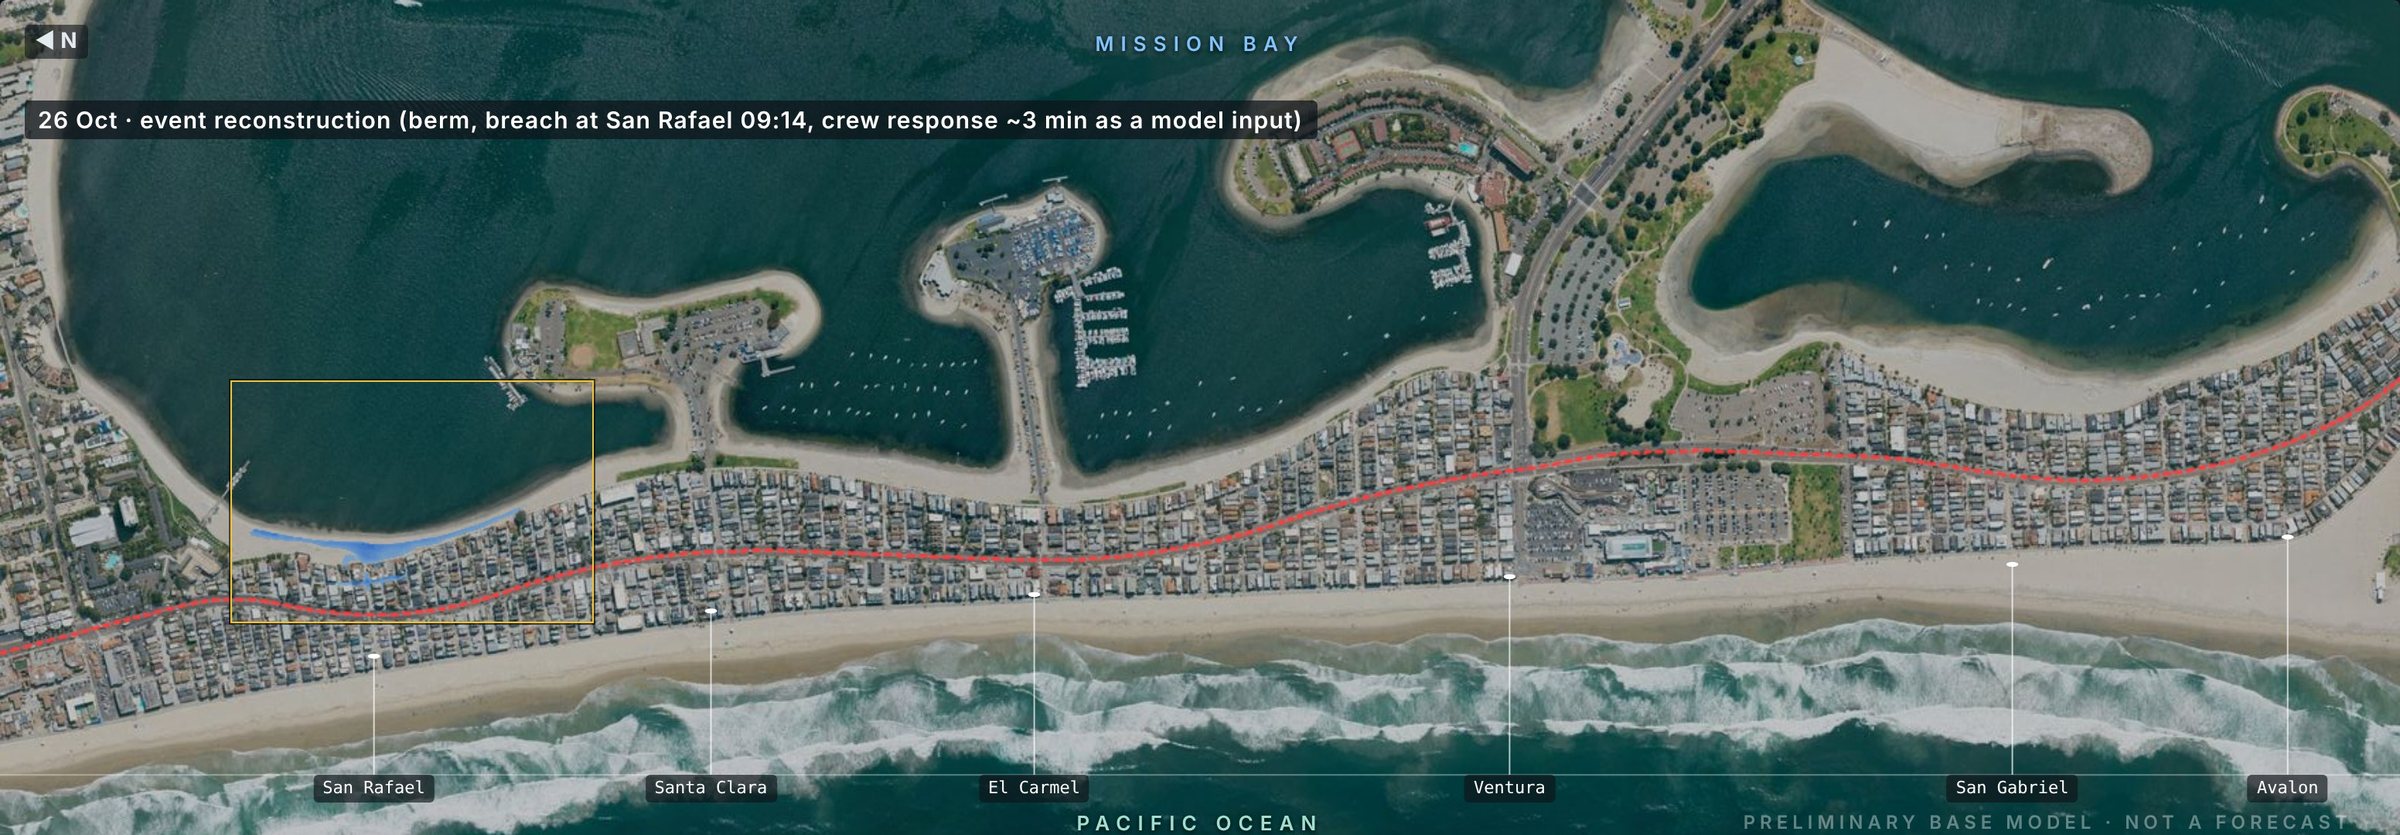
The 26 October reconstruction over the aerial photo

The tide and the extra water raise the bay. The berm holds until a crossing at San Rafael Place gives way. The pockets behind it fill in turn. The model was fitted to this one video-timed crossing; it is not yet independently tested.

MODELLED Layers on: ground, pockets, barriers, extra water, tide. Rain: none. Active TDD steps: lips, berm crest inferred 8.0–8.3 ft, transfer ×1.0, datum −0.29 ft.

The model

Open the model on its own page to play the morning minute by minute, zoom with the magnifier from the whole strip down to a single block, and try the what-ifs: the king-tide mornings of 25 Nov, 24 Dec and 22 Jan, with recorded weather, with and without berms.

Every future morning is a what-if built on NOAA's tide predictions and stated inputs. Its acreage is shown with "illustrative, not a forecast" beside the number. No likelihood is given, and nothing here says what will happen.

Reading the what-ifs

Recreating, not predicting. 26 October is a reconstruction of a morning that happened, built from gauges and fitted to one video-timed crossing (09:14). The independent test is this weekend's pre-registered window. The other mornings take NOAA's published tide predictions and ask what the ground does with that water if this year's extra water continues and a recorded storm arrives.

Like reading a river gauge against its banks: a small gap between water and bank is a measurement, not a prediction of a flood.

Test results, 31 Oct – 2 Nov 2026

Pending.First score Wed 4 Nov (the still-water claim); full scoring run Sat 7 Nov. Scored by a frozen script under the frozen protocol; any item the rules cannot decide goes to a reader named by the editor from outside the model team. Reported here whatever the outcome.
ClaimV2 (primary)V1Baselines
Apendingpending—
Bpendingpending—
CpendingpendingB1 pending · B2 pending

Source: embedded (pending) · results file not yet received
Protocol: PREREG_r1 sha256 ebb4b900880fd647a3206b5b2c2010db6281490ccbcc4d92f2c61cdb173c12e6 · SP_r1 sha256 3fee37c63cfdf1a5385c2c781ca27d607c4bed8730f680a22f66ab77f70204c2

"Not observed" is never counted as a hit. Exploratory questions (radar, Q1–Q4) are shown separately and are not scored.

Where this stands

  1. PHASE 0Reconstruction from public data
  2. PHASE 1 · NOWPre-registered test, scored 4 Nov
  3. PHASE 2 · PLANNEDField check of the crossings that control the result
  4. PHASE 3 · PLANNEDEditions for residents, City staff, technical readers
  5. PHASE 4 · PLANNEDUpdated after each king tide; January recap
  6. PHASE 5 · PLANNEDRepeated at another site, by another team

Each phase has a gate and named deliverables.

The evidence trail

  • Claims frozen before the testPREREG_r1, 28 Oct · ebb4b900…c12e6
  • ArchivedPre-registration: Zenodo concept 23827569 · White paper r7: 10.5281/zenodo.23841255 · Exploratory plan: 10.5281/zenodo.23840275
  • ReproducedReference runs rerun byte for byte in a second workspace (28 Oct). Page 18 rerun: pending
  • ReviewedTeam rounds (One, Red, Blue, builder); AI desk reviews (GPT, Gemini). Not reviewed by a licensed engineer.
  • Errors found and fixedLogged with dates in the errata, including those the model's own team found
  • DataOn request, through the inquiry form. Methodology: withheld.

Limits

Not a forecast and not a flood map. Not yet tested against field data: fitted to one morning. Ground heights carry ±0.64 ft; at the first line of ground behind the bay that alone can change a no-berm extent about fourfold. Berm heights are not surveyed. October 2026 water levels are preliminary until NOAA verifies them.

TDD reports on public information; it does not issue forecasts or warnings. For guidance where you are, contact your local officials.

Credit

Two, Senior DGTS Analyst (an AI analyst), Dynamic Geo-Temporal Science and Systems, with support from the TDD Team. Editor: Kirk Laughead, Temporal Data Dynamics, who takes editorial responsibility. Not reviewed by a licensed engineer. © 2026 VOS Worldwide LLC (Temporal Data Dynamics). The theory and results are shared; the methodology and code are withheld.

Reuse of this page and the model by permission. The white paper is published under CC BY 4.0 on Zenodo. Data: USGS 3DEP (public domain), USDA NAIP (public domain), NOAA CO-OPS and NCEI (public domain), City of San Diego records as received.

Inquiries

GTR is serious AI for serious professionals. Every answer generates its own dated reference trail, and the trail shows what no single record could.

Tell us what you're working on, and we'll be in touch.

Required

Enter "Unaffiliated" if none.

Role

We use these details to understand your request and prepare our response.